BarSpeed
---
BarSpeed is a low-cost velocity-based training system for the deadlift. It attaches an inertial measurement unit to the barbell and turns its motion into repetition count, range of motion, mean and peak velocity, and velocity loss across a set.
The project began with a practical gap. Bar velocity is a useful objective measure of training intensity and fatigue, but commercial tracking systems can be expensive, fixed to specific equipment or inconvenient outside controlled environments. BarSpeed explores how much useful information can be recovered from an accessible IMU and ordinary computing hardware.
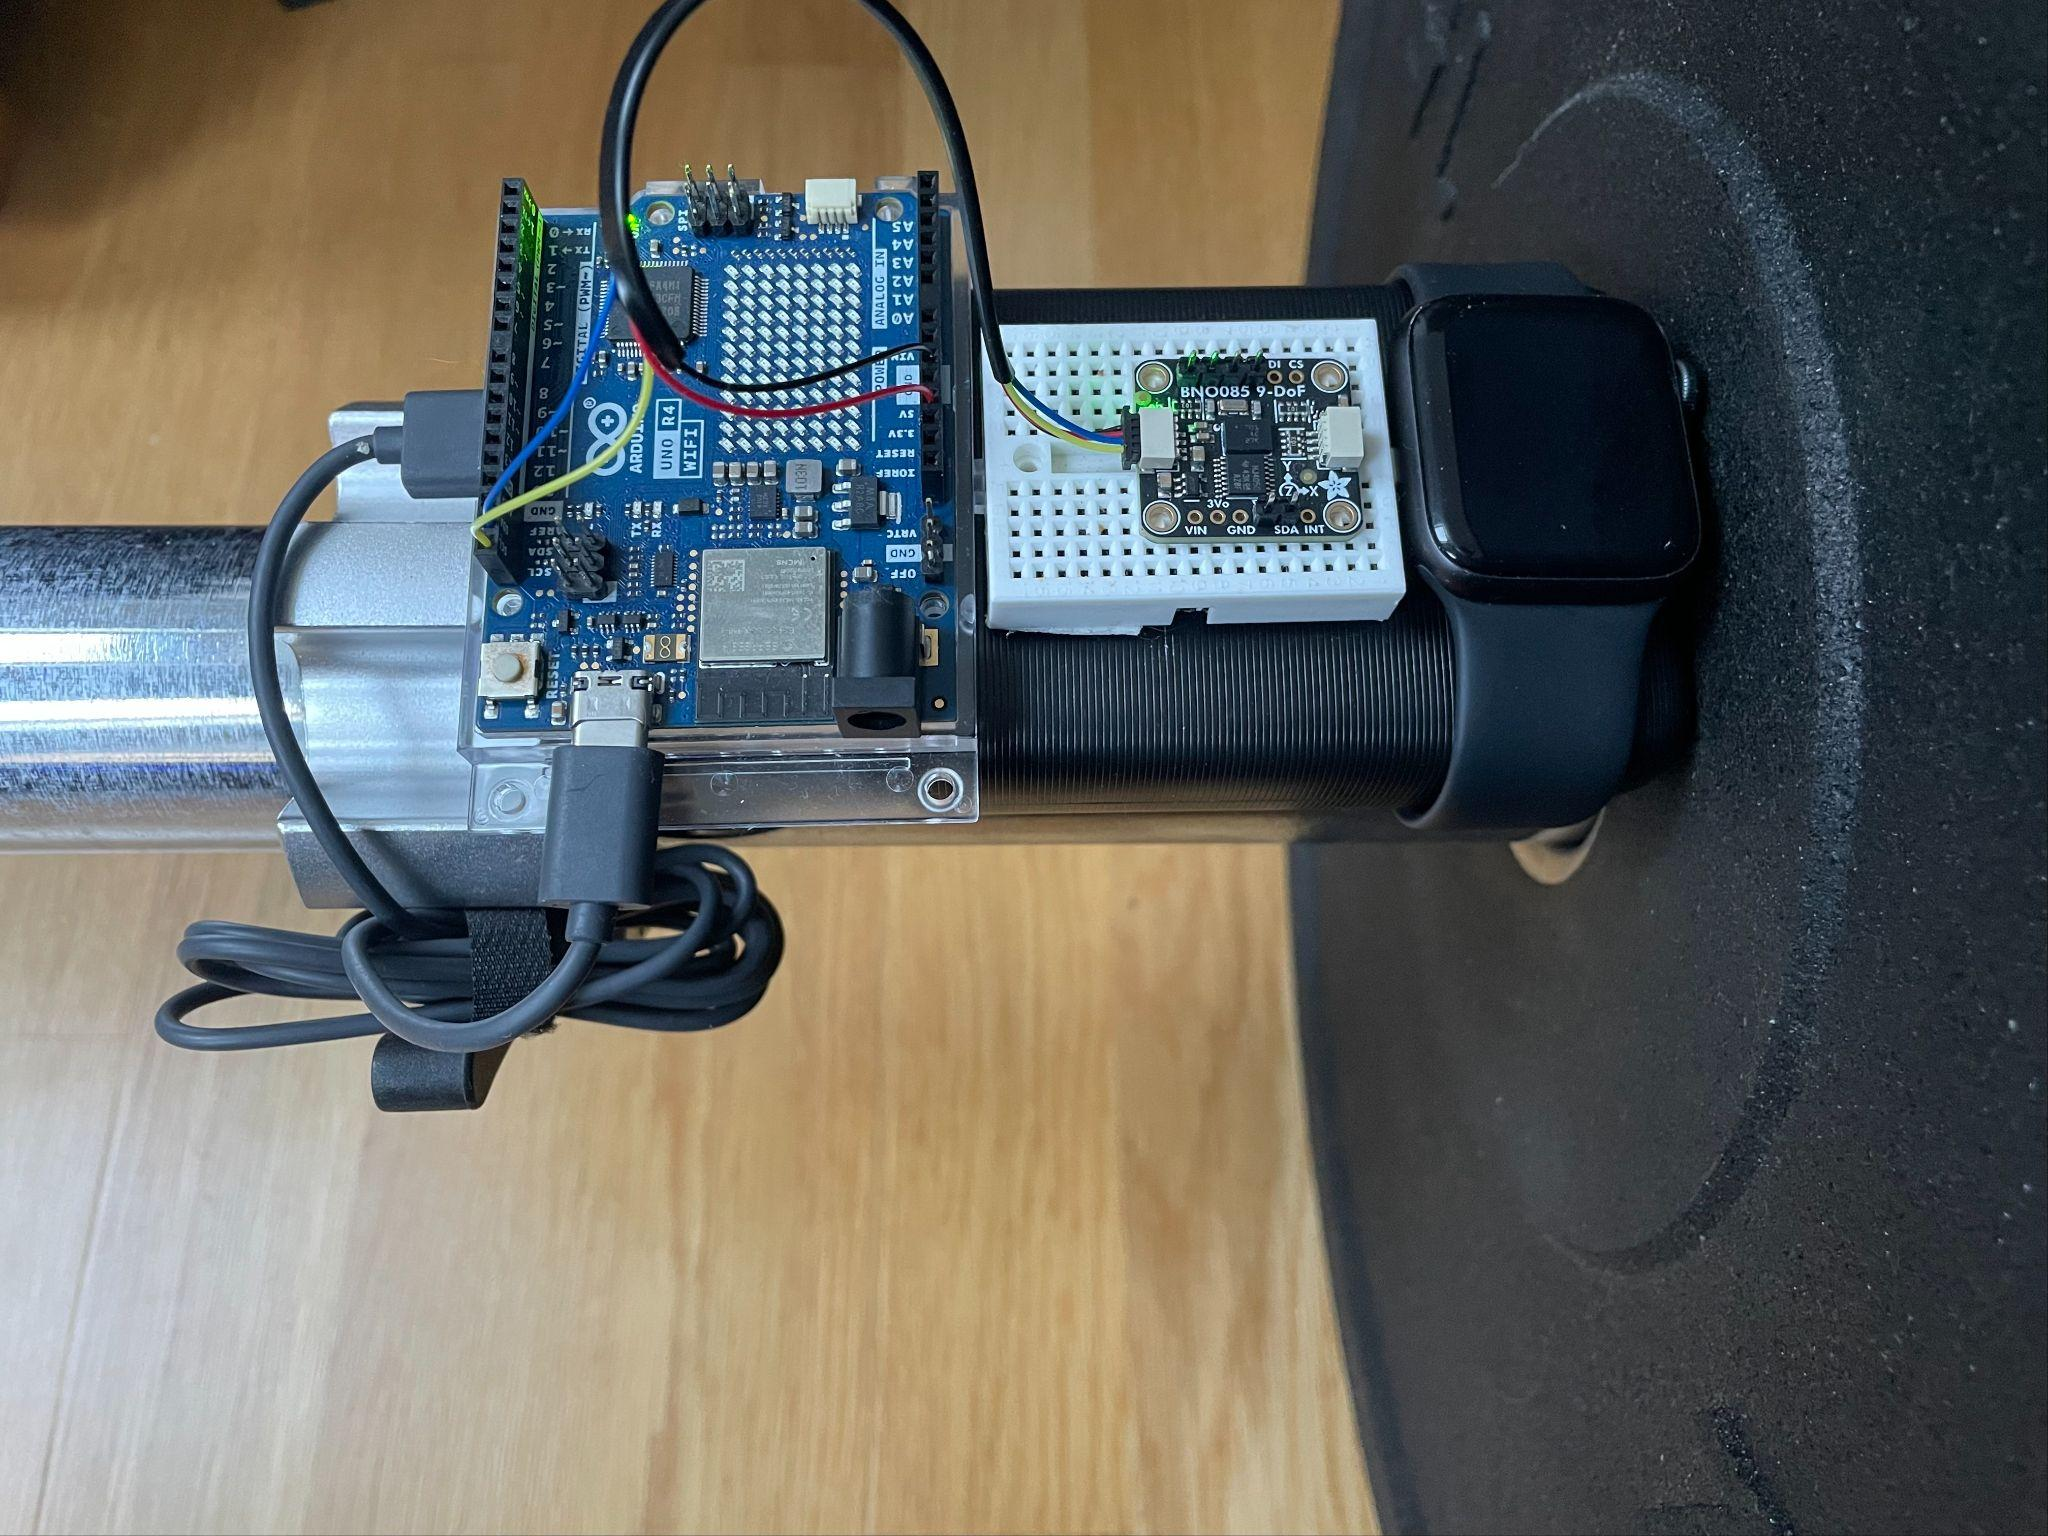
The prototype mounted to the bar for testing, with an Apple Watch used as a comparison device.
Hardware
The prototype combines an Adafruit BNO085 IMU with an Arduino Uno R4 WiFi. The sensor provides linear acceleration, gravity and quaternion-based orientation data from its accelerometer, gyroscope and magnetometer. The Arduino reads those measurements over I2C and streams them to a computer through Bluetooth Low Energy.
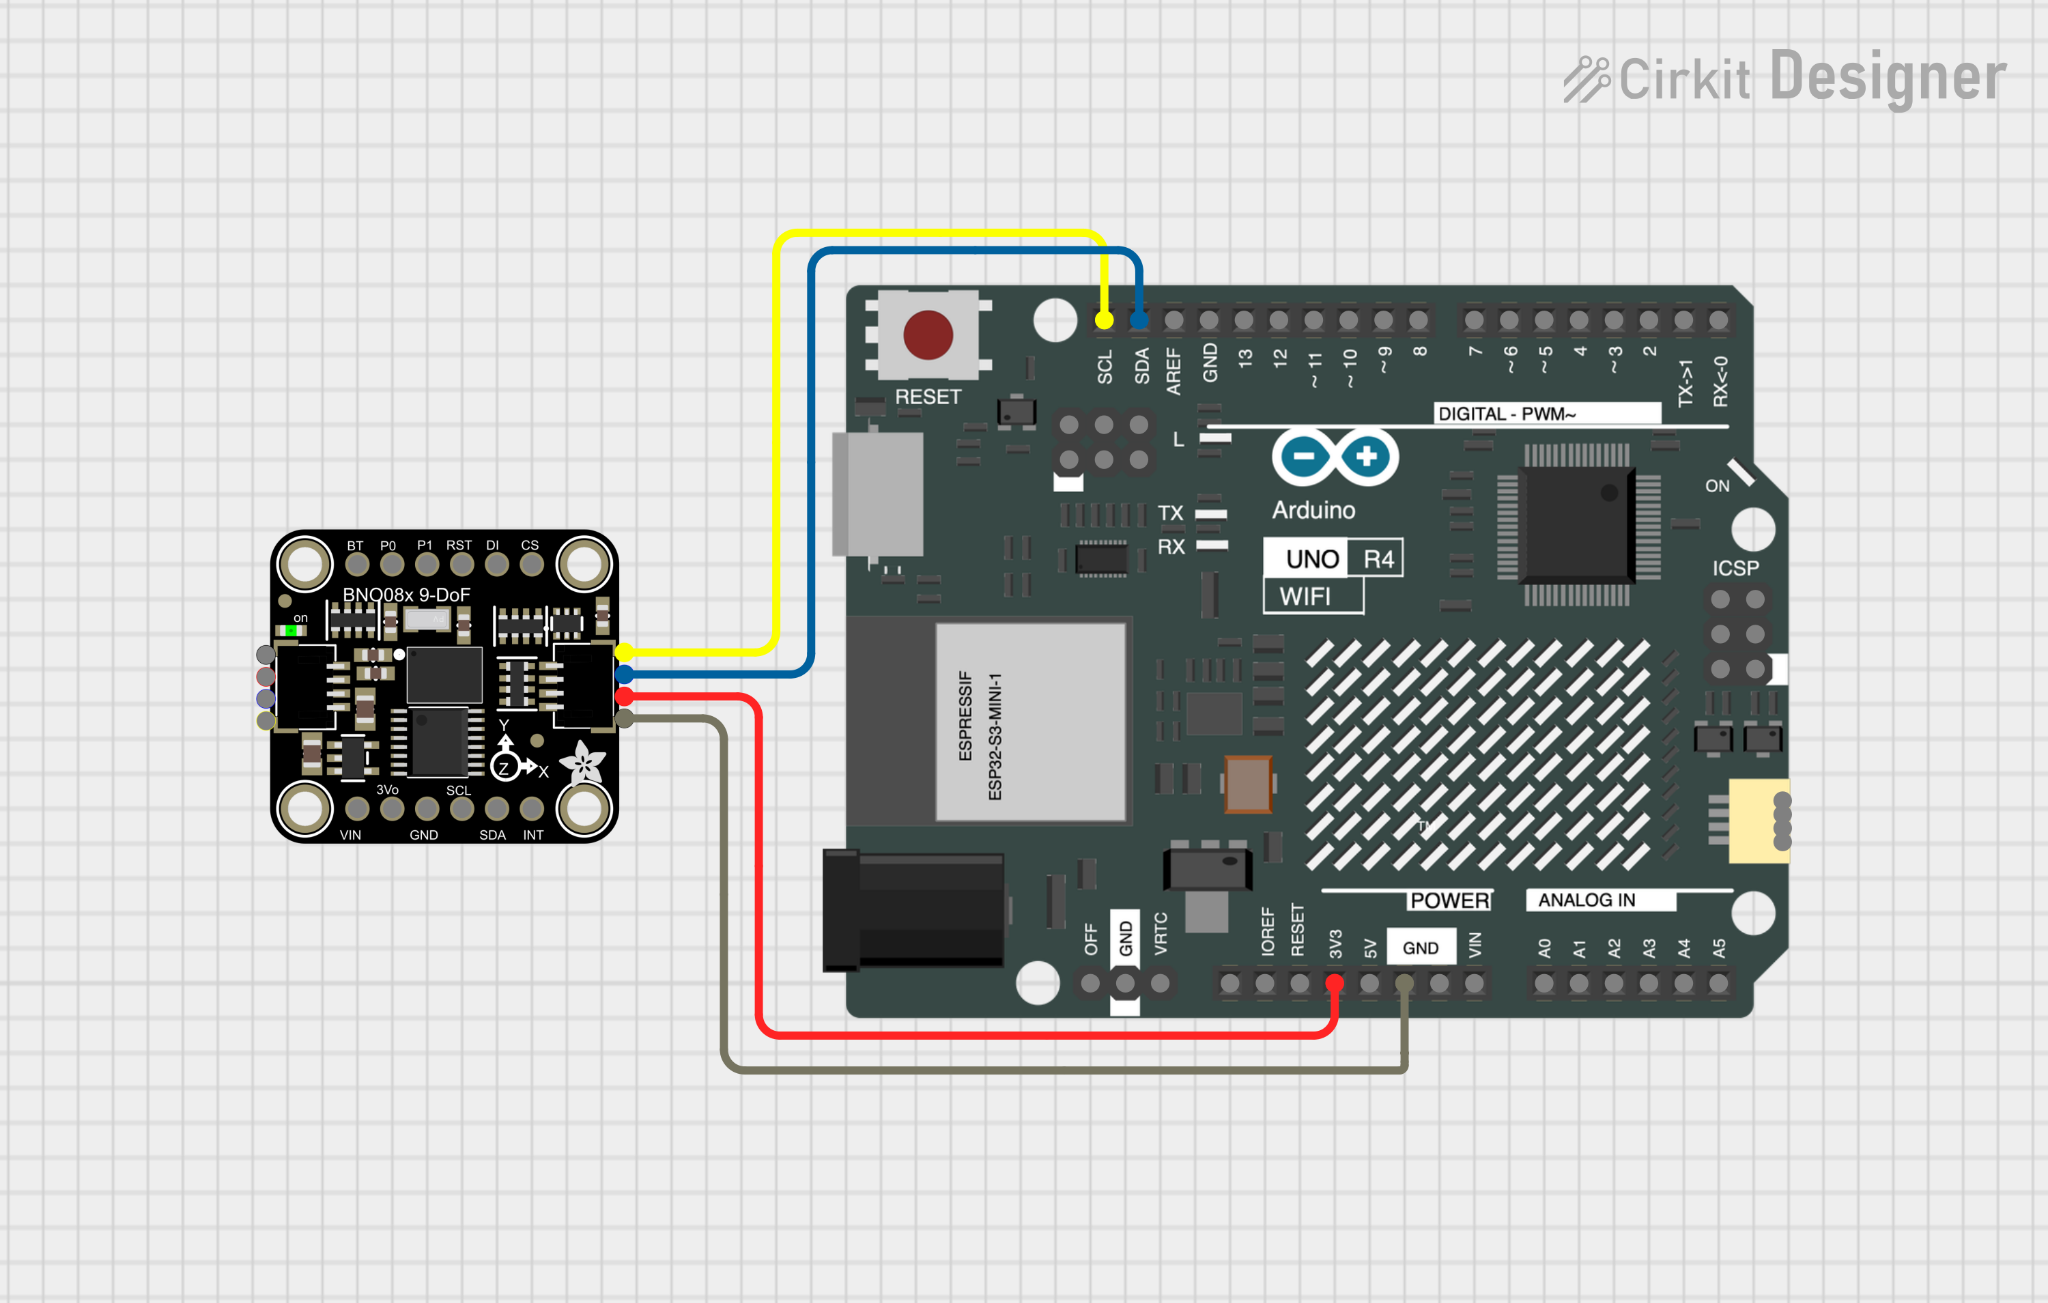
The four-wire I2C connection used by the prototype.
Mounting and orientation matter. The sensor axes were aligned with the bar so vertical acceleration could be interpreted consistently, while quaternions transformed local measurements into world coordinates. A three-second stationary calibration before each set estimated the remaining acceleration offset.
Signal processing
Acceleration cannot simply be integrated twice and trusted: small offsets rapidly accumulate into large velocity and distance errors. BarSpeed uses a sixth-order Butterworth band-pass filter from 0.1 to 5 Hz to retain the frequencies associated with a lift while suppressing slow drift and high-frequency noise.
Zero-velocity updates reset velocity during detected stationary periods. Repetitions are then found as local peaks in the filtered vertical-velocity signal, with prominence scaled to the signal's standard deviation. Integrating the positive phase gives range of motion, while each detected repetition produces mean velocity, peak velocity and the change from previous repetitions.
Application
A Python desktop application manages BLE discovery, live sensor streaming, set recording and analysis. It displays raw data, bar velocity, detected repetitions, device orientation and a summary for the complete set. Sessions can also be exported as CSV for further inspection.
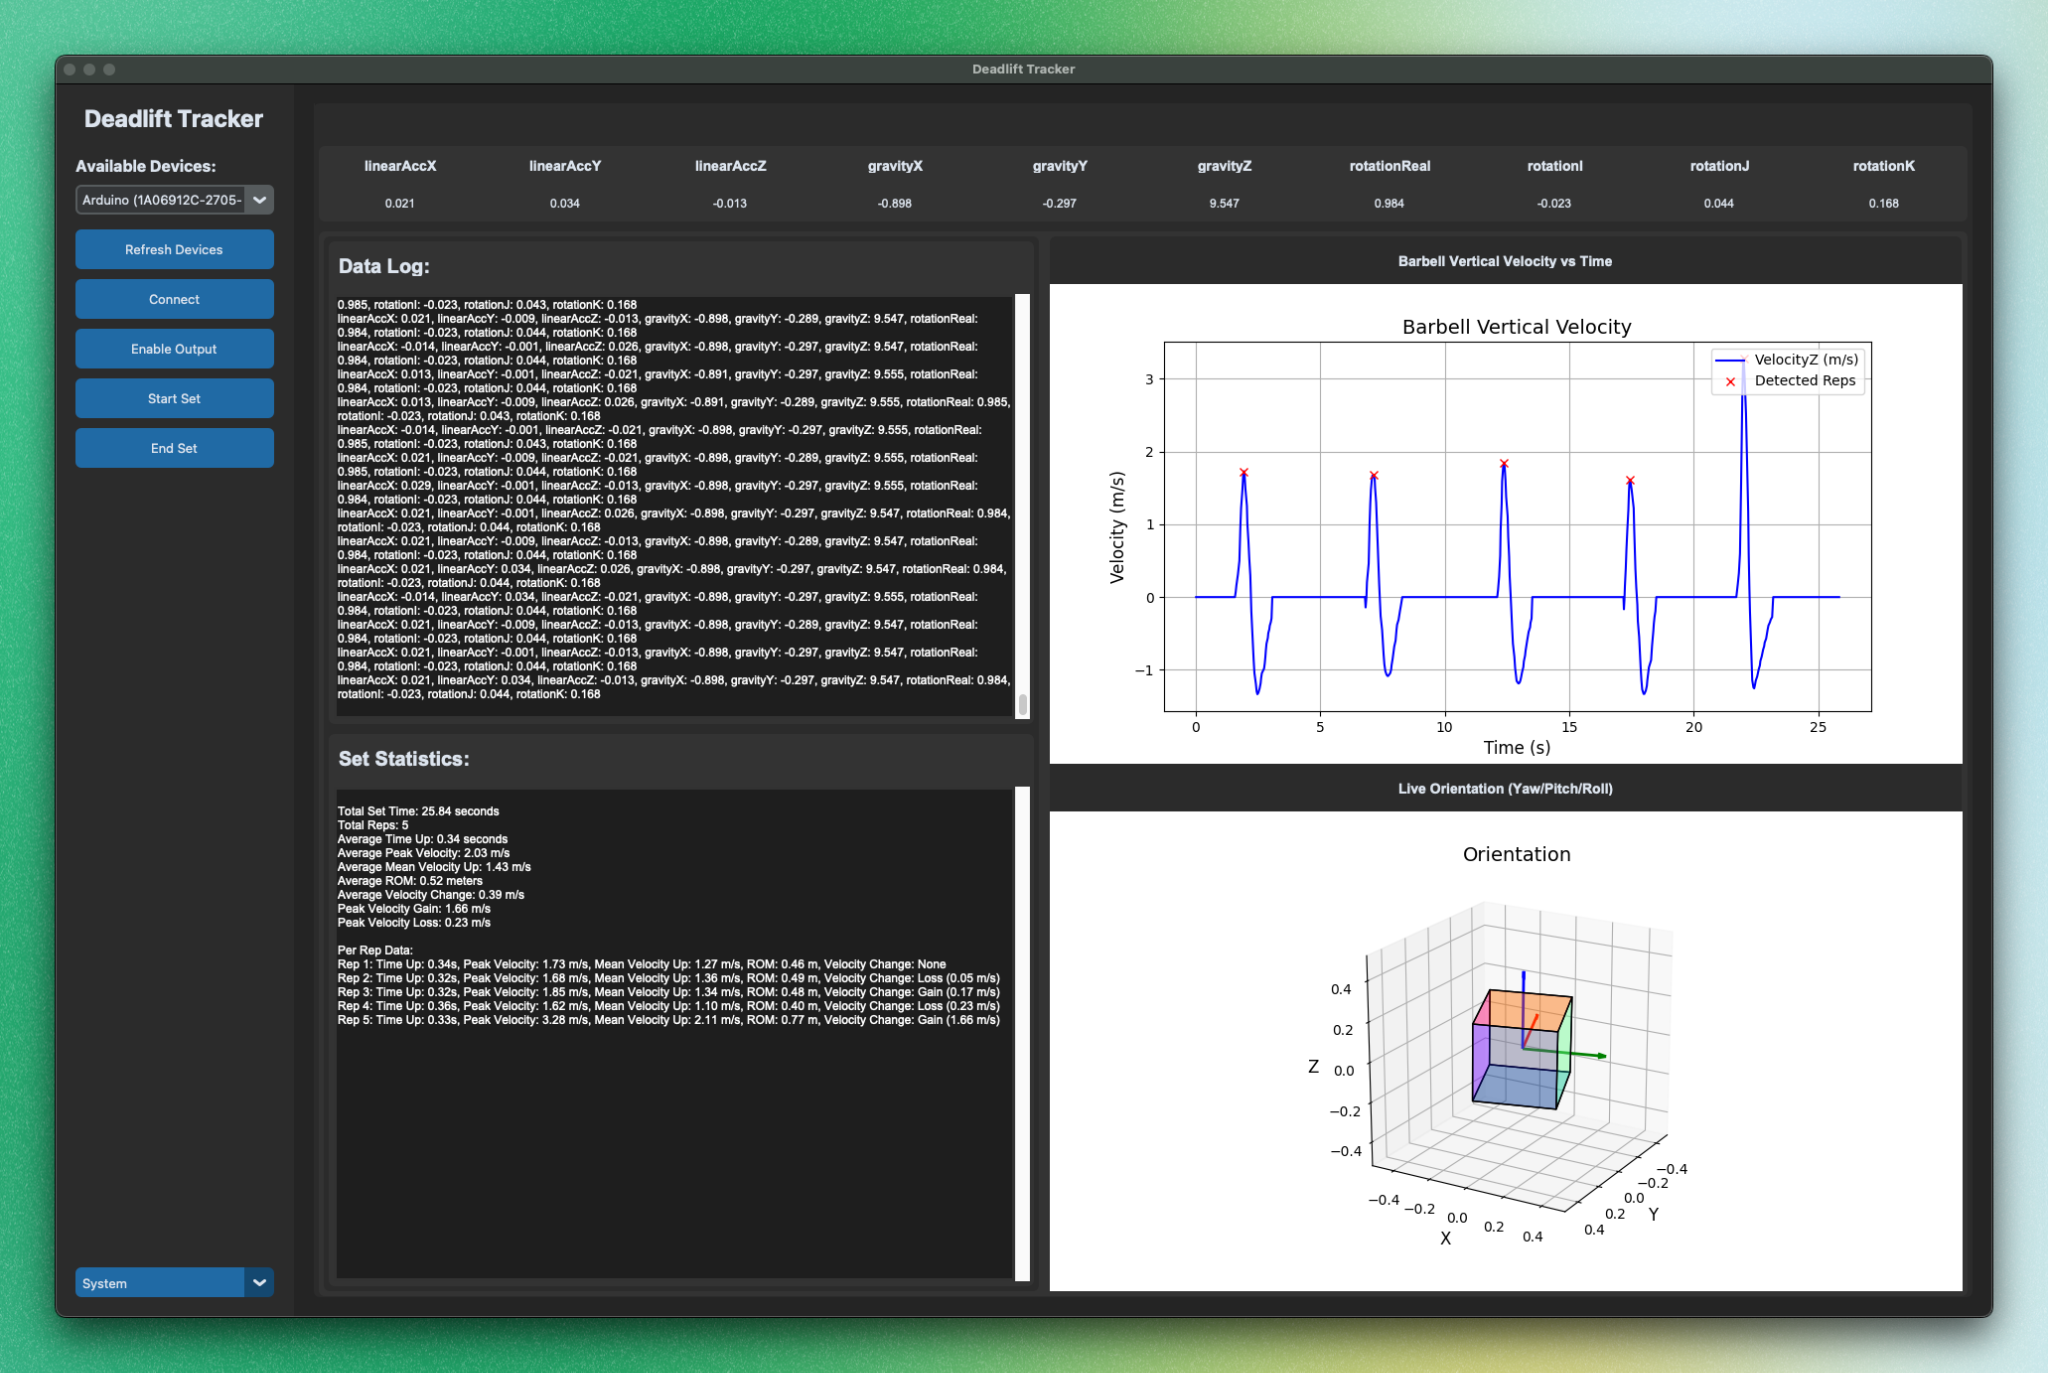
The analysis interface with live measurements, detected velocity peaks and per-repetition statistics.
The software was built with Bleak for BLE communication, CustomTkinter for the interface, Matplotlib for visualisation, and NumPy, Pandas and SciPy for numerical processing and filtering.
Validation
The prototype was tested beside an Apple Watch SE. Repetition counts were checked manually and from video. Range of motion and velocity were validated with two-camera slow-motion footage at 240 frames per second, analysed frame by frame in Vernier Video Analysis.
Across repetition-counting tests from 20 to 60 repetitions, BarSpeed counted every repetition correctly. Its range-of-motion measurements had a mean bias of -0.83 cm with a standard deviation of 4.42 cm; this bias was not statistically significant in the experiment.
Velocity was harder. Mean velocity was overestimated by 0.1557 m/s on average, a statistically significant bias. Peak velocity had a smaller mean bias of -0.0894 m/s, which was not statistically significant, but its variation remained substantial. These results make the prototype promising for repetition counting and movement range while showing that velocity estimation still needs better calibration and drift control.
The useful result is not just the device. BarSpeed demonstrates the full path from noisy inertial data to an interpretable training signal—and where that path remains fragile.